NBA Halftime Betting Analysis: Half-by-Half Statistics
 Available in US
The phone changed everything. Keith Baker, reflecting on the explosion of sports betting since 2018, nailed it: “People just weren’t thinking at that point about how fast this whole thing was going to end up in the palm of your hand.” Nowhere is that transformation more visible than halftime betting. What used to require a phone call to a bookie now happens instantly on an app while you grab a snack during the break.
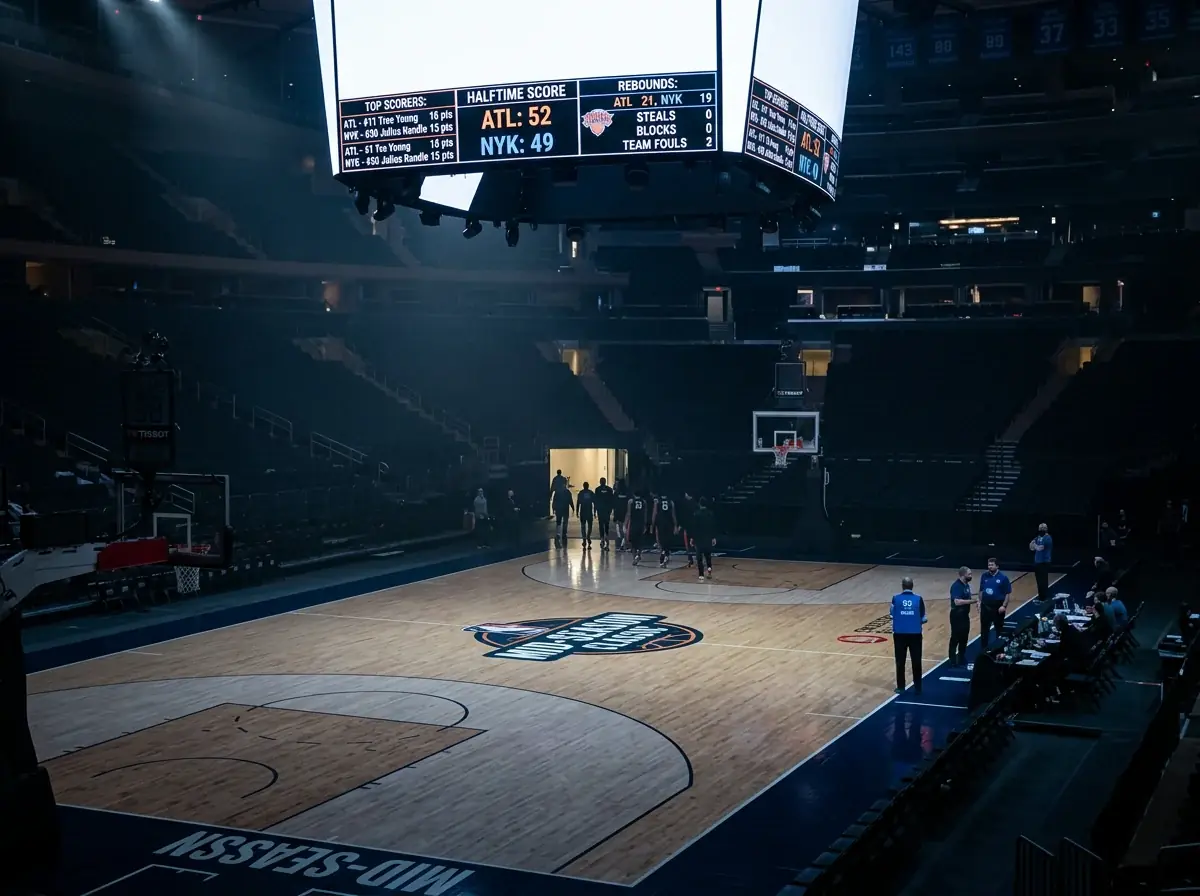
Halftime represents the most natural break point in any basketball game. Both teams retreat to locker rooms. Coaches make adjustments. Bettors get 15-20 minutes to digest what they have seen and position for the second half. The market that exists during this window has its own patterns, its own inefficiencies, and its own opportunities.
NBA First Half Trends and Halftime Betting Lines
First half performance sets the stage for everything that follows, but reading that performance correctly requires understanding what is signal versus noise in 24 minutes of basketball.
Scoring in the first half tends to be less efficient than in the second half. Teams are still finding rhythm, adjustments have not been implemented, and unfamiliarity with defensive schemes creates disrupted possessions. First half shooting percentages average 2-3 points lower than second half shooting percentages across the league.
The first quarter is particularly volatile. Early foul trouble, lineup experimentation, and game-to-game variance make first quarter outcomes poor predictors of final results. By halftime, the sample size has at least doubled, giving us more reliable data to project forward.
Pace in the first half establishes tempo for the game but often differs from second half pace. Teams that start slow might push harder after halftime. Teams that ran in the first half might tire and slow down. I track the delta between teams’ typical pace and their first half pace to project second half adjustments.
One consistent pattern: teams that significantly underperform their expected first half total often regress toward their mean in the second half. If a team averaging 58 first half points scores only 44, they are more likely to exceed their typical second half output than to continue struggling. Mean reversion is a powerful force, and halftime betting lets you capture it.
Halftime Adjustments
The 15-minute intermission gives coaches an opportunity that does not exist at any other point in the game: dedicated time to diagnose problems and implement solutions. The quality of those adjustments varies dramatically between coaching staffs, and tracking adjustment patterns creates betting edge.
Elite coaches make impactful halftime adjustments more consistently than average coaches. When their team trails at halftime, they identify defensive vulnerabilities to attack and offensive breakdowns to fix. The second half performance of well-coached teams shows lower variance from expected baselines because adjustments smooth out first half anomalies.
Specific adjustment types are predictable. A team that gave up 60 first half points to an opponent averaging 52 will tighten defensive rotations. A team whose star shooter went 0-for-6 from three will create different looks in the second half. I anticipate these adjustments when setting my second half expectations.
Live betting during halftime reflects real-time adjustment anticipation. Lines move as informed bettors assess what they saw and project what coaches will change. Getting your halftime bets in early – before the market fully processes first half information – can capture value that evaporates by the time the second half tips off.
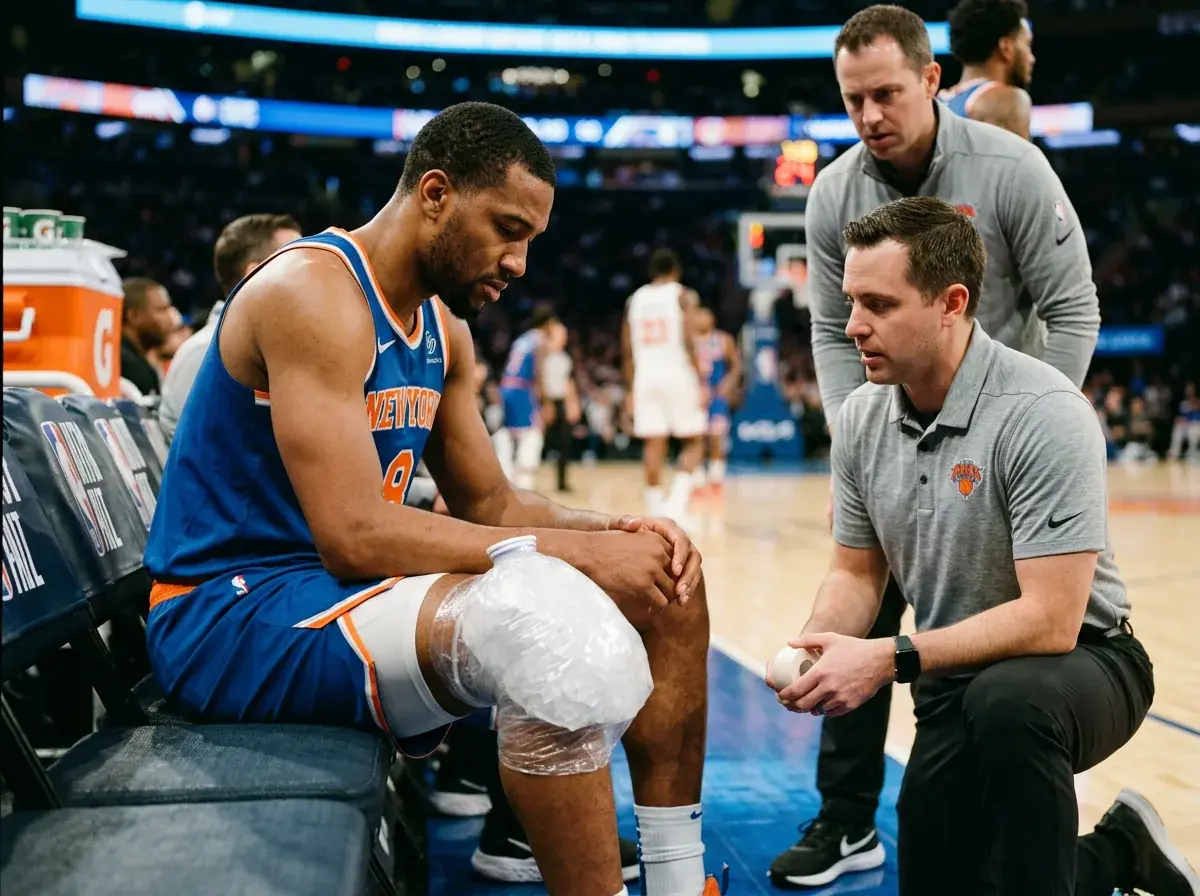
One underappreciated factor: injury and foul trouble updates during halftime. A player who looked hobbled in the first half might be announced as questionable. A star with three fouls will have his second half minutes managed differently. This information flows during the break and moves markets.
Second Half Projections
Projecting second half outcomes requires combining first half observations with baseline expectations and adjustment forecasts. It is a synthesis that separates serious halftime bettors from casual observers.
My second half projection model starts with pre-game expectations, then adjusts based on three inputs: first half scoring differential, first half pace relative to expected pace, and identified adjustment opportunities. A team that trailed by 8 at halftime despite playing near their expected level needs only a minor adjustment to close the gap. A team that trailed by 8 while playing well below standard has more room for regression.
Totals projections for the second half follow different patterns than spreads. Teams often slow down in the second half regardless of first half pace – fatigue accumulates, coaches manage leads, and trailing teams sometimes concede rather than forcing high-variance possessions. Second half unders have shown slight positive value in my historical tracking.
The game total at halftime is particularly interesting. If the pre-game total was 220 and the first half produced 115 combined points, the market must now decide: was the first half an outlier, or should we expect the second half to continue at that elevated pace? I lean toward regression in most cases, which means betting under on game totals after high-scoring first halves has shown edge.
Player props reset at halftime, and this creates opportunities. A player who scored 18 points in the first half sees his second half points prop inflated. But shot attempts are finite, and a player who shot 15 times in the first half is unlikely to get 15 more in the second half. I target unders on second half props for players who over-produced in the first half.
Halftime Value Spots
Specific halftime situations consistently produce betting value. I have catalogued these patterns and target them actively during every NBA betting day.
Road teams trailing by 7-12 at halftime offer value on second half spreads. The margin is significant but not insurmountable. The home team often relaxes slightly while the road team comes out with renewed intensity. I have tracked positive ROI betting road underdogs in this halftime deficit range.
Teams that shot unusually well from three in the first half often see regression in the second half. If a team that averages 35% from three went 10-for-18 in the first half, their second half three-point shooting will likely decline. This creates value on second half unders for that team’s offense.
First half over/under results tend to invert in the second half. A game that was 8 points over the first half total often lands under the second half total. A game that was 8 points under the first half total often lands over the second half total. This mean reversion pattern is not overwhelming but provides a directional lean when combined with other factors.
Live betting markets are most efficient in the final two minutes before halftime and first two minutes after. The chaos of quarter-ending possessions and half-opening possessions creates volatile lines. The halftime break itself – those 15-20 minutes when no game action occurs – is when I find the most exploitable mispricings.
Integrating Halftime Data Into Full-Game Strategy
Halftime betting does not exist in isolation. It connects to pre-game positions, live betting during play, and fourth quarter opportunities. A coherent strategy integrates all these elements.
When I have a pre-game position, I use halftime to reassess. If my pre-game bet looks strong based on first half observations, I might add to the position. If my pre-game bet looks compromised, I might hedge or accept the loss early rather than hoping for a comeback that my analysis suggests is unlikely.
Halftime is also a decision point for new positions. Games I passed on pre-game sometimes reveal first half information that clarifies my assessment. A matchup I was uncertain about might show clear tendencies that now inform a second half bet.
The connection to fourth quarter betting is direct. First half patterns often continue or reverse in predictable ways that affect fourth quarter situations. A team that dominated the first half but let the lead slip in the third quarter enters the fourth with momentum patterns worth tracking.
Live betting dominates NBA wagering now, with over 60% of US online action coming in-play. Halftime sits at the center of that ecosystem – a structured break that gives bettors time to think, analyse, and position. Using that time wisely separates profitable live bettors from those chasing action without strategy.
Do teams that lead at halftime usually win?
Teams leading at halftime win approximately 75-80% of NBA games. However, the spread matters more than the outright win for betting purposes. Halftime leaders often fail to cover large second half spreads as they manage the game rather than extend leads.
How do halftime totals compare to pre-game totals?
First half totals are generally less predictable than full game totals due to smaller sample sizes. Second half totals show slight regression toward scoring means, meaning high-scoring first halves often precede lower-scoring second halves and vice versa.
What adjustments do bookmakers make at halftime?
Bookmakers reset spreads and totals based on first half results, team pace, and known adjustment patterns. Lines move most actively in the first few minutes of halftime as the market processes observed performance, then stabilize before second half tip.
Published by the Betting Stats nba team.