
NBA Quarter Betting Strategies: Per-Period Statistics
 Available in US
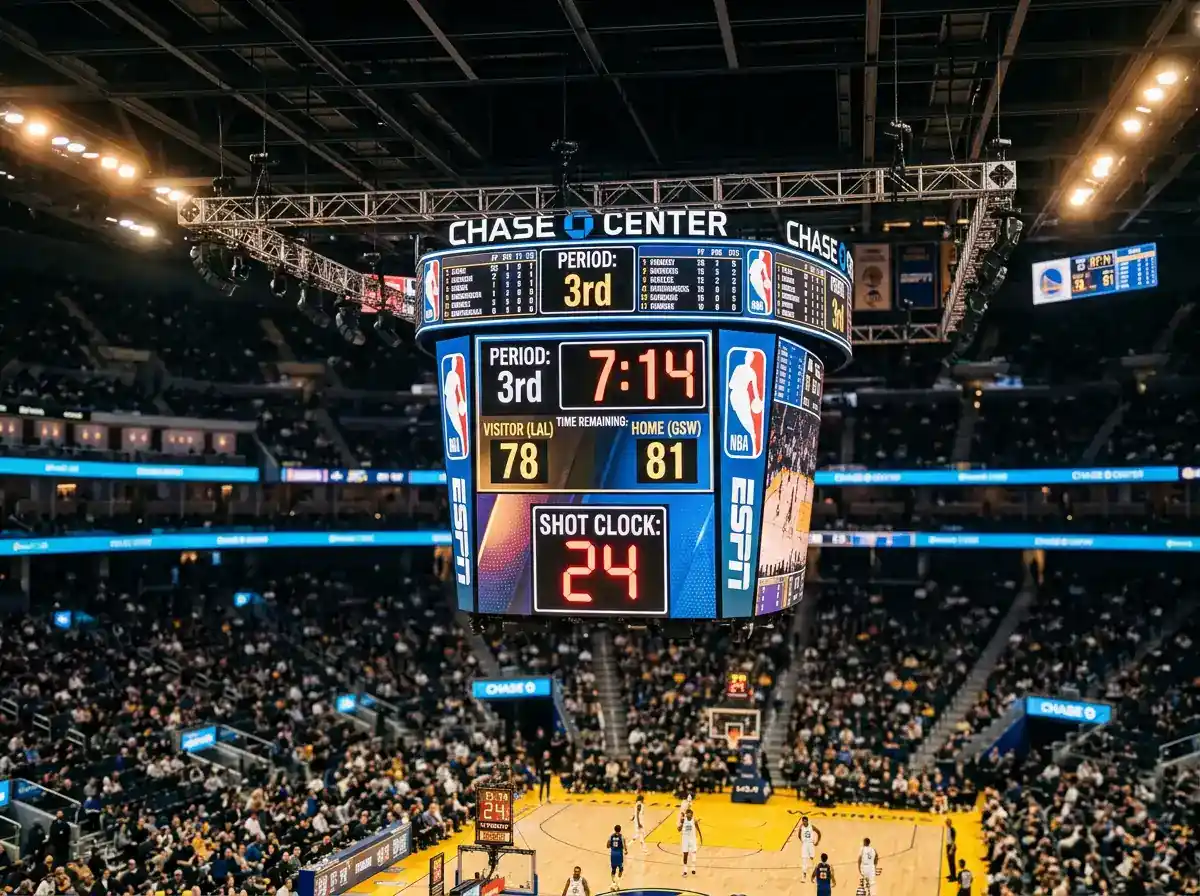
I built an entire betting system around first quarters after noticing something odd: the same team kept winning first quarters by 4-6 points, then coasting through the remaining three periods. Their full-game spread was priced correctly, but their first quarter spread was not. That edge lasted two months before the market caught on. Quarter betting rewards those who look where others do not.
Dividing games into quarters creates four distinct betting opportunities from a single contest. Each quarter has different characteristics, different dynamics, and different market efficiencies. Understanding these per-period patterns unlocks a dimension of NBA betting that most bettors ignore entirely.
NBA First Quarter Statistics and Per-Period Trends
First quarters are the most volatile period of any NBA game. Both teams are still finding rhythm. Rotations have not settled. The game script is undetermined. This volatility creates both risk and opportunity for bettors.
Scoring efficiency typically runs lower in first quarters than in subsequent periods. Shooting percentages are depressed as players warm up. Offensive sets take longer to execute as teams probe defensive approaches. The result is first quarter totals that often fall short of pro-rated game expectations.
First quarter spreads show higher variance than full-game spreads. A team favored by 8 for the full game is typically around -2 for the first quarter. But actual first quarter margins swing wildly – that -2 favorite might win the quarter by 10 or lose it by 6 depending on who hits early shots. The predictability that emerges over 48 minutes does not exist in 12 minutes.
Some teams consistently perform better or worse in first quarters relative to their overall quality. Fast starters jump out to early leads, then manage games. Slow starters dig holes, then rally. I track first quarter performance differentials versus full-game performance to identify teams whose first quarter lines are systematically mispriced.
Injury and rest news affects first quarters disproportionately. A team missing a key player might start a backup who needs time to settle in. A rested team might come out aggressive while a fatigued team starts slow. These factors show up most clearly in first quarter performance before games normalize.
Quarter by Quarter Trends
Each quarter has distinct patterns worth understanding. The twelve minutes are not interchangeable – different dynamics emerge at different points in the game.
Second quarters see increased scoring as players find rhythm. Benches enter the game, creating mismatches that starters do not face. Coaches experiment with lineups, sometimes to their detriment. Second quarter totals trend higher than first quarter totals in most games.
Third quarters produce the largest scoring swings. Halftime adjustments take effect. Teams that trailed often come out with renewed intensity. The period is long enough for runs to develop and short enough that deficits feel recoverable. Third quarter spreads are particularly unpredictable.
Fourth quarters depend entirely on game state, as discussed in fourth quarter analysis. Close games produce one pattern; blowouts produce another. Projecting fourth quarter outcomes requires knowing the third quarter margin, which makes pre-game fourth quarter betting essentially impossible.
I focus most quarter-specific betting on first and second quarters where pre-game information remains relevant. Third and fourth quarter markets are better suited for live betting once game state becomes clear.
Fast Starters vs Slow Starters
Team identities around early-game performance create systematic betting angles. Some teams consistently outperform expectations in first quarters; others consistently underperform. These patterns are more persistent than most bettors realize.
Fast-starting teams often share characteristics: veteran lineups that need minimal warm-up, coaching emphasis on early aggression, offensive systems that execute well from the opening tip. These teams build leads that they protect through subsequent periods.
Slow-starting teams show the opposite profile: younger players who take time to settle, passive early-game approaches, offensive systems that require rhythm to execute. These teams often fall behind early before rallying.
The betting angle is straightforward: bet first quarter spreads on fast starters against slow starters, especially when the full-game line suggests a competitive matchup. A team favored by 3 for the game might deserve to be favored by 4 or 5 for the first quarter if they are fast starters facing slow starters.
I maintain a database of first quarter performance versus expectation for every team. The leaders and laggards remain remarkably consistent month over month. This consistency makes first quarter betting one of the more reliable angle types in my portfolio.
Motivation affects first quarter performance. A team in a revenge spot might come out fired up and dominate the opening period before settling into normal play. A team playing its fourth game in six days might start sluggish regardless of their usual pattern. Context modifies baseline expectations.
Quarter Totals Analysis
Quarter totals offer a different risk-reward profile than full-game totals. The reduced sample size increases variance but also increases the potential for market mispricing.
Pro-rating the full game total to derive quarter expectations is a common approach but misses important nuances. First quarters tend to go under relative to pro-rated totals. Third quarters tend to go over. A 220-point game total does not mean four 55-point quarters – it might mean 52, 57, 58, and 53.
I track actual quarter scoring distributions for each team and compare them to market quarter totals. Discrepancies between my distribution-based expectation and the posted line reveal betting opportunities.
Pace affects quarter totals differently than full-game totals. High-pace teams might play especially fast in first quarters when legs are fresh, then slow down as fatigue accumulates. The pace trajectory matters for quarter-specific projections.
Late-game totals depend on margin, making pre-game quarter total bets on third and fourth quarters essentially random. I avoid these markets unless I have specific game-state information from live betting context.
Building a Quarter Betting Approach
Systematic quarter betting requires dedicated tracking that most bettors do not maintain. The edge exists precisely because the work required deters casual participants.
Start by tracking first quarter results for every game over several weeks. Note which teams outperform or underperform their quarter lines consistently. Patterns will emerge – some teams always start fast, some always start slow, and these tendencies persist.
Identify matchups where first quarter expectations should diverge from full-game expectations. A fast starter versus a slow starter should have a larger first quarter spread than the pro-rated full-game spread implies. A slow starter versus a slow starter should have a smaller first quarter total than pro-rating suggests.
Size quarter bets smaller than full-game bets. The variance is higher due to smaller sample sizes within each game. A profitable quarter betting strategy might show more volatility in results even while maintaining positive expected value. Smaller bets smooth the ride.
Track results separately for each quarter type. Your first quarter strategy might be profitable while your third quarter strategy loses money. Segment analysis reveals which quarter-specific approaches deserve continued betting and which deserve abandonment.
The live betting connection matters. First quarter results inform second quarter expectations. A team that dominated the first quarter might see their second quarter line adjusted unfavorably. Conversely, a team that underperformed the first quarter might offer second quarter value as regression kicks in. Treat quarter betting as a connected sequence rather than isolated events.
Are first quarter results predictive of full game outcomes?
Moderately. Teams that win first quarters win full games more often than not, but comebacks are common. First quarter margins are more volatile than full-game margins, so first quarter dominance does not guarantee full-game victory or spread coverage.
Which quarter has the highest scoring on average?
Third quarters typically show the highest scoring due to halftime adjustments and renewed intensity. Second quarters are next highest as players find rhythm. First quarters score lowest due to warm-up effects and defensive uncertainty.
How do I identify fast-starting and slow-starting teams?
Track first quarter performance versus expected margins based on full-game spreads. Teams that consistently beat first quarter expectations by 2+ points are fast starters. Teams that consistently underperform by 2+ points are slow starters. These patterns persist across seasons.
Published by the Betting Stats nba team.